 A Brief History of IHTI Research
~30,000 "Total Body" DEXA X-Ray Scans
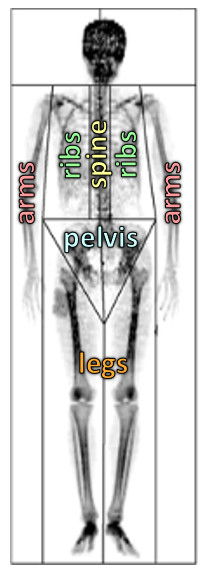
The DEXA Scan is the "gold standard" for measuring total body and regional fat mass (FM), fat-free mass (FFM), bone mineral density (BMD) and bone mineral content (BMC) in the entire body as well as in each of the five regions shown below.
While most of our DEXA testing has been conducted in Texas, a significant number of tests have been conducted across the US and Canada through the use of our mobile testing units as shown below. While not a truly representative sample of the US population or ethnicity, the database does represent a relatively diverse population with regard to subjects living in the United States.

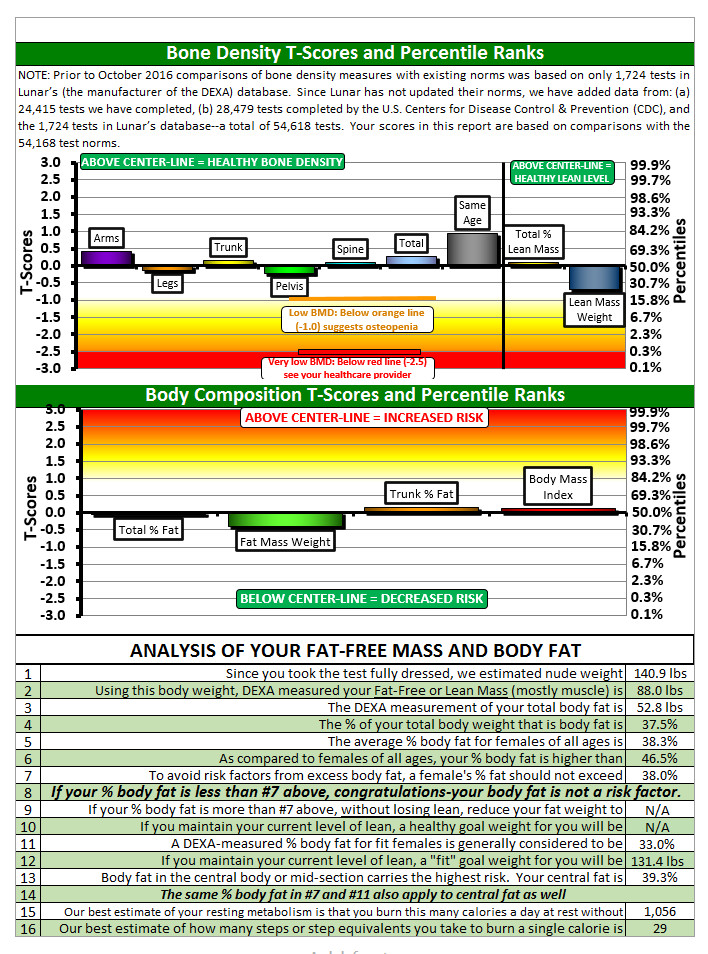
Abbreviated Report Provided to Study Participants
Assessing the Validity and Reliability of IHTI's DEXA Scans
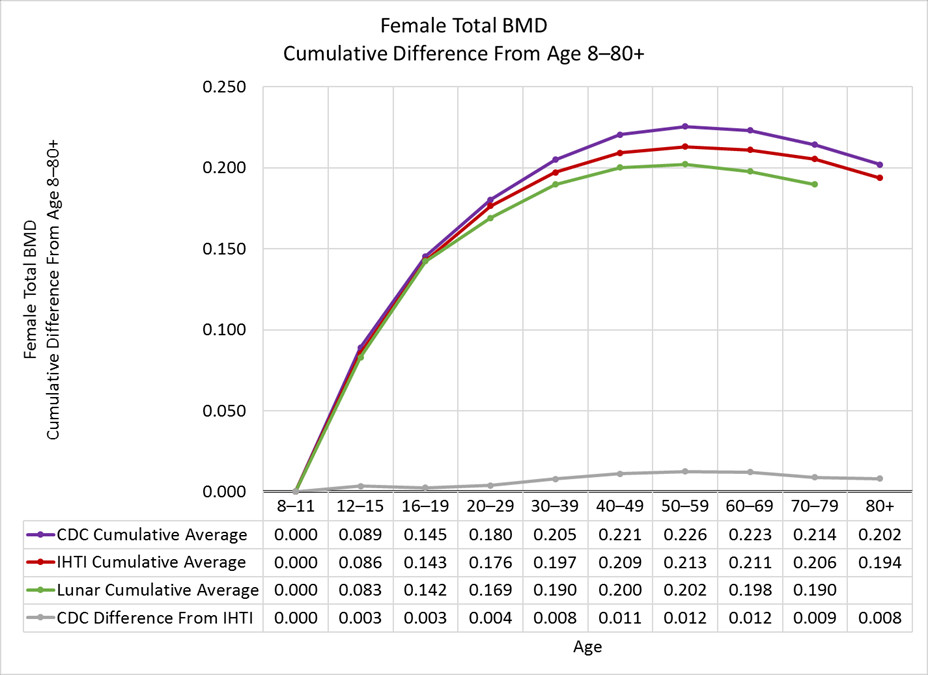
Validity. To validate the accuracy (or "validity") of IHTI’s DEXA scans, comparisons were graphed for annual BMD changes in IHTI’s sample of 19,260 females with corresponding changes in 14,093 females in the U.S Centers’ for Disease Control’s (CDC) DEXA database and 2,055 females in GE Lunar’s DEXA database. These three curves are shown below. As the data below show, the curves are virtually identical and rarely differ by more than 2% from each other.
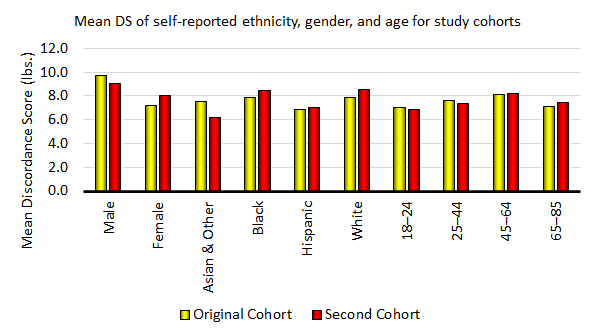
Another way of evaluating the validity of a data set is to conduct a second follow-up or replication study using different subjects following the same procedures to evaluate if the outcomes are the same or similar. To this end, we used the study we previously conducted and published of a national diverse sample of 3,870 subjects. We compared the differences between using the widely-accepted Body Mass Index (BMI) versus a proposed, novel statistic, a Body Composition Change Index (BCCI) as outcome measures for weight change intervention. This study was published in Nugent S, Kaats GR, Mrvichin N, Keith P, Preuss HG. Discordance Between Body Mass Index (BMI) and a Novel Body Composition Change Index (BCCI) as Outcome Measures in Weight Change Interventions. J Am Coll Nutr. 2018 May-Jun; 37(4)302-307). It addressed a problem with the BMI in that the BMI scores both losses of lean (muscle and bone) and losses of body fat as positive outcomes and gains of fat and gains of lean as negative outcomes. In contrast, the BCCI scores both losses of fat and gains of lean as positive outcomes, and gains of fat and losses of lean as negative outcomes. The BCCI is the net of these positive and negative outcomes. As shown in Table 1, there was a 7.79 lb. discordance between the two scoring methods—a difference that was independent of gender, ethnicity or age as shown in Table 2. To examine the validity of the findings in the initial study, a replication study was conducted four years later using 5,460 different subjects. As shown in Table 3, the discordance in the replication study was remarkably similar to the initial study (7.79 lbs. vs. 8.33 lbs.) and, as in the initial study, was also independent of gender, ethnicity and age.
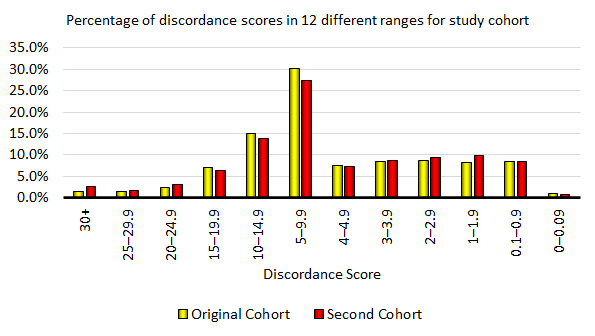
| Table 1 (Original Cohort). Percentage of discordance scores in 12 different ranges for study cohort (N = 3,870, x̄=7.79 lbs., SD=7.4 lbs.). | ||
|---|---|---|
| Discordance range | # | % |
| 30+ | 57 | 1.5% |
| 25–29.9 | 53 | 1.4% |
| 20–24.9 | 95 | 2.5% |
| 15–19.9 | 270 | 7.0% |
| 10–14.9 | 578 | 14.9% |
| 5–9.9 | 1,167 | 30.2% |
| 4–4.9 | 294 | 7.6% |
| 3–3.9 | 329 | 8.5% |
| 2–2.9 | 342 | 8.8% |
| 1–1.9 | 322 | 8.3% |
| 0.1–0.9 | 326 | 8.4% |
| 0–0.09 | 37 | 1.0% |
| Table 2 (Original Cohort). Distributions of self-reported ethnicity, gender, and age for study cohort (N = 3,870). | ||||
|---|---|---|---|---|
| Variables | n | % | Mean DS | SD of DS |
| Gender | ||||
| Male | 890 | 23% | 9.7 | 9.2 |
| Female | 2,980 | 77% | 7.2 | 6.6 |
| Ethnicity | ||||
| Asian & Other | 110 | 3% | 7.5 | 7.7 |
| Black | 114 | 3% | 7.9 | 5.8 |
| Hispanic | 318 | 8% | 6.9 | 5.6 |
| White | 3,328 | 86% | 7.9 | 7.5 |
| Age (years) | ||||
| 18–24 | 207 | 5% | 7 | 5.4 |
| 25–44 | 1,523 | 39% | 7.6 | 7.1 |
| 45–64 | 1,866 | 48% | 8.1 | 7.8 |
| 65–85 | 274 | 7% | 7.1 | 6.5 |
| Table 3 (Second Cohort). Percentage of discordance scores in 12 different ranges for study cohort (N = 5,460, x̄=8.33 lbs., SD=9.61 lbs.). | ||
|---|---|---|
| Discordance range | # | % |
| 30+ | 150 | 2.7% |
| 25–29.9 | 90 | 1.6% |
| 20–24.9 | 173 | 3.2% |
| 15–19.9 | 346 | 6.3% |
| 10–14.9 | 754 | 13.8% |
| 5–9.9 | 1,499 | 27.5% |
| 4–4.9 | 405 | 7.4% |
| 3–3.9 | 481 | 8.8% |
| 2–2.9 | 510 | 9.3% |
| 1–1.9 | 540 | 9.9% |
| 0.1–0.9 | 464 | 8.5% |
| 0–0.09 | 48 | 0.9% |
| Table 4 (Second Cohort). Distributions of self-reported ethnicity, gender, and age for study cohort (N = 5,460). | ||||
|---|---|---|---|---|
| Gender | ||||
| Male | 1,477 | 27% | 9.1 | 10 |
| Female | 3,983 | 73% | 8.1 | 9.5 |
| Ethnicity | ||||
| Asian & Other | 50 | 1% | 6.2 | 4.6 |
| Black | 331 | 6% | 8.5 | 7.3 |
| Hispanic | 748 | 14% | 7.1 | 9 |
| White | 4,331 | 79% | 8.6 | 9.9 |
| Age (years) | ||||
| 4–17 | 214 | 4% | 19.5 | 20.2 |
| 18–24 | 164 | 3% | 6.9 | 6.2 |
| 25–44 | 976 | 19% | 7.4 | 6.2 |
| 45–64 | 3,128 | 60% | 8.2 | 8.9 |
| 65–85 | 978 | 19% | 7.4 | 10.1 |
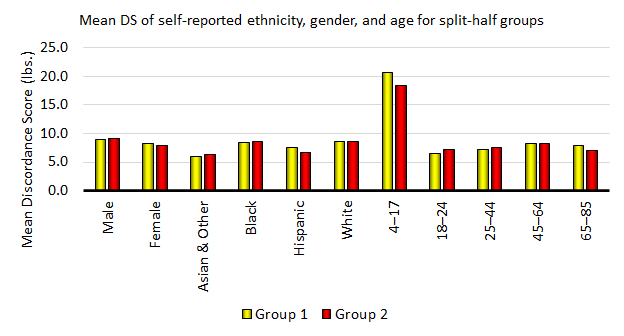
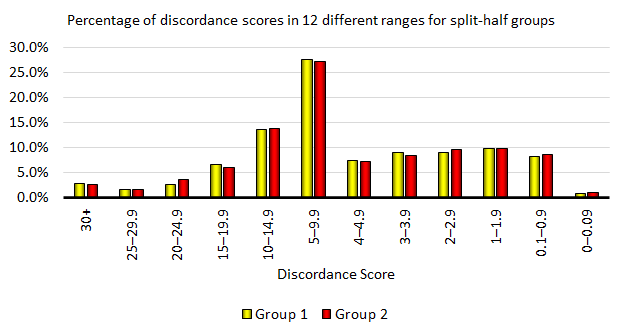
Reliability. One method of assessing reliability is through the use a split-half design wherein the data sample is randomly divided into two equal sub-samples and compared. If the data sample is reliable or internally consistent, the two sub-samples should also correlate. Subsets in both the original and replication study correlated positively with each other, thus providing a replication of the original study.
| Variables | Group 1 n | Group 1 % | Group 1 Mean DS | Group 1 SD of DS | Group 2 n | Group 2 % | Group 2 Mean DS | Group 2 SD of DS |
|---|---|---|---|---|---|---|---|---|
| Gender | ||||||||
| Male | 751 | 28% | 9.0 | 10.1 | 726 | 27% | 9.1 | 9.8 |
| Female | 1,979 | 72% | 8.2 | 9.8 | 2,004 | 73% | 7.9 | 9.1 |
| Ethnicity | ||||||||
| Asian & Other | 25 | 0.9% | 6.0 | 4.1 | 25 | 0.9% | 6.3 | 5.0 |
| Black | 175 | 6% | 8.4 | 7.3 | 156 | 6% | 8.6 | 7.3 |
| Hispanic | 354 | 13% | 7.6 | 10.2 | 394 | 14% | 6.6 | 7.8 |
| White | 2,176 | 80% | 8.6 | 10.0 | 2,155 | 79% | 8.5 | 9.7 |
| Age (years) | ||||||||
| 4–17 | 106 | 4% | 20.7 | 21.5 | 108 | 4% | 18.4 | 18.8 |
| 18–24 | 75 | 3% | 6.4 | 6.8 | 89 | 3% | 7.2 | 6.6 |
| 25–44 | 489 | 19% | 7.3 | 5.9 | 487 | 19% | 7.5 | 6.5 |
| 45–64 | 1,581 | 60% | 8.2 | 8.9 | 1,547 | 59% | 8.2 | 8.8 |
| 65–85 | 479 | 18% | 7.9 | 10.7 | 499 | 19% | 7.0 | 9.4 |
| Discordance range | Group 1 # | Group 1 % | Group 2 # | Group 2 % |
|---|---|---|---|---|
| 30+ | 79 | 2.9% | 71 | 2.6% |
| 25–29.9 | 47 | 1.7% | 43 | 1.6% |
| 20–24.9 | 75 | 2.7% | 98 | 3.6% |
| 15–19.9 | 183 | 6.7% | 163 | 6.0% |
| 10–14.9 | 374 | 13.7% | 380 | 13.9% |
| 5–9.9 | 754 | 27.6% | 745 | 27.3% |
| 4–4.9 | 205 | 7.5% | 200 | 7.3% |
| 3–3.9 | 248 | 9.1% | 233 | 8.5% |
| 2–2.9 | 246 | 9.0% | 264 | 9.7% |
| 1–1.9 | 271 | 9.9% | 269 | 9.9% |
| 0.1–0.9 | 227 | 8.3% | 237 | 8.7% |
| 0–0.09 | 21 | 0.8% | 27 | 1.0% |